
Evolution and Genotype-Phenotype Mappings (RNA Networks)
If you want to understand function, study structure.
The above statement is attributed to F. H. C. Crick and it’s the opening quote of the excellent book on networks The Structure of Complex Networks by E. Estrada. The mathematical theory of evolution as the result of motions in the space of sequences or genotypes is an active field of research involving the use of various tools and techniques ranging from the theory of stochastic processes, to bioinformatics, passing through the full family of ‘omics’.
The project I am involved in at the minute is studying the topologies spanned by
the sets of all the possible genotypes or sequences of a given length $l$ which can be formed using the four letter
alphabet $\{A,C,T,G\}$
and calculating their corresponding biochemical function or phenotype. Redundancy will divide the full space of $4^{l}$ into $N$ subsets
$\{\Omega_k\}_{k=1}^N$ each one representing a phenotype. Then, by employing the metric induced by single point mutations, the sets $\Omega_k$ can be
connected if they possess sequences which are at a
The properties of resultant graph or phenotype landscape allow us to treat the problem of evolution as the problem of a walker in a complex network, which can be treated using the standard tools of statistical physics. This approach relies on a very strong assumption. Namely, the knowledge of a well defined genotype-phenotype mapping, this is not easy to satisfy for the vast majority of real systems, however for the case of RNA molecules and moderately long sequences, the secondary structure can be considered as a very good approximation or proxy for such mapping.
This project is very much work in progress, but because I like to share code and data, I prepared an Ipython notebook which illustrates the ideas of the previous paragraph (construction of the phenotype landscape) for a very special system: the genetic code. For the case of RNA, a nice example can be seen used as the banner on the main page of this site.
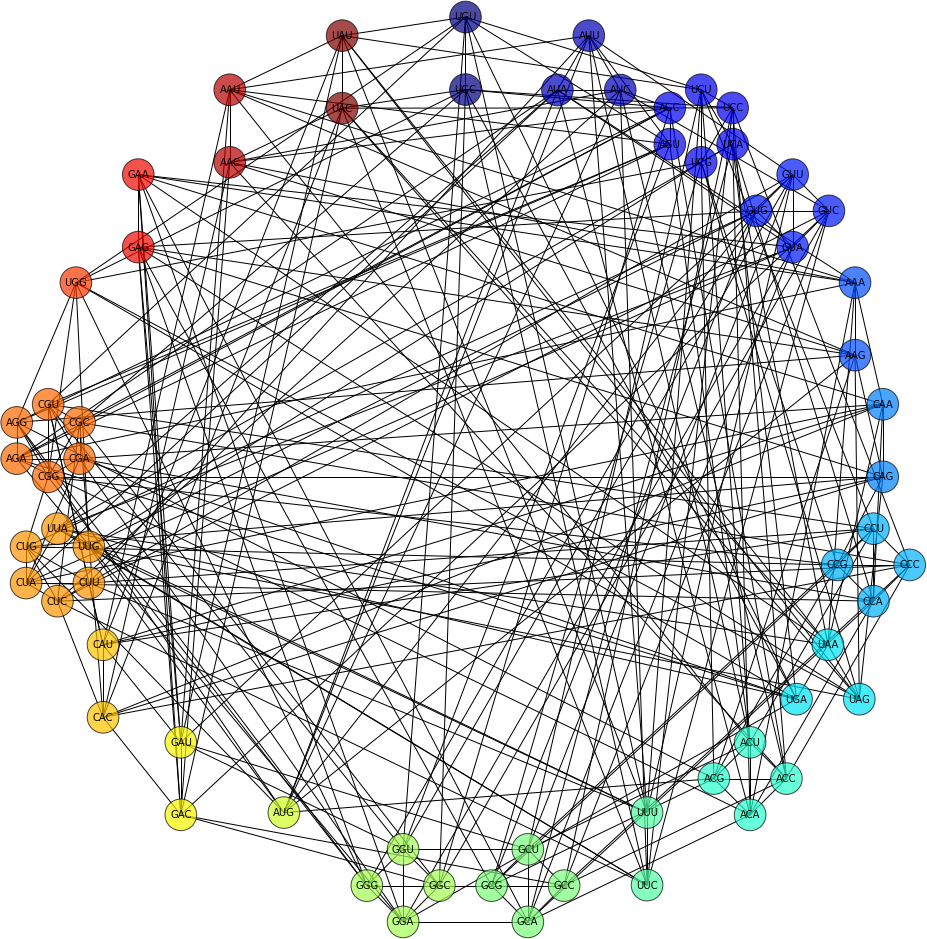
In the notebook, I show how to generate all the codons, organise them into their respective aminoacid classes, and how to construct and draw a number neutral network diagrams like the one shown below. The entire topology is generated by linking every pair of codons which are one mutation away from each other.
Genetic code notebook and neutral networks (nbviewer)
As stated before, the notebook contains code to generate networks like the one below. The image links to the source code (Github repo).
WebGL interactive explorer
The repository also contains the the code of a very robust, but still in a very early stage of development, interactive network explorer for the same system. The aim of the visualization tool is to be able to quickly render and explore networks and multiplexes with interactive features in real time within a browser, applying a precalculated layout, (notice the similarities between the two dimensional and three dimensional representations).
The latter is also an active project and it is updated often, so make sure check the site every now and then to see if there are any improvements. If there is enough interest we will set up a curated repository. For now its just a lunch-time hack of the draggable nodes example at three.js
Be sure that your browser supports WebGL and that it is enabled (help here).
THREE.JS-WEBGL INTERACTIVE GENETIC CODE NETWORK EXPLORER HERE.
THREE.JS-WEBGL RNA NETWORK (L=12) HERE.